.png?width=480&height=336&name=Illus%20(4).png)
.png?width=94&height=64&name=Logo%20Ku%20(1).png)


If you’ve ever struggled to keep track of multiple projects, team progress, or blockers in your workflow, a Jira dashboard might be the visual representation your team needs.
From software development and project management to improving team organization, dashboards help you stay aligned, focused, and efficient.
In this article, we’ll walk you through how to create, customize and use Jira dashboards effectively, whether you work in sprints, handle multiple projects, or support remote team members.
Understanding Jira dashboards
What is a Jira dashboard?
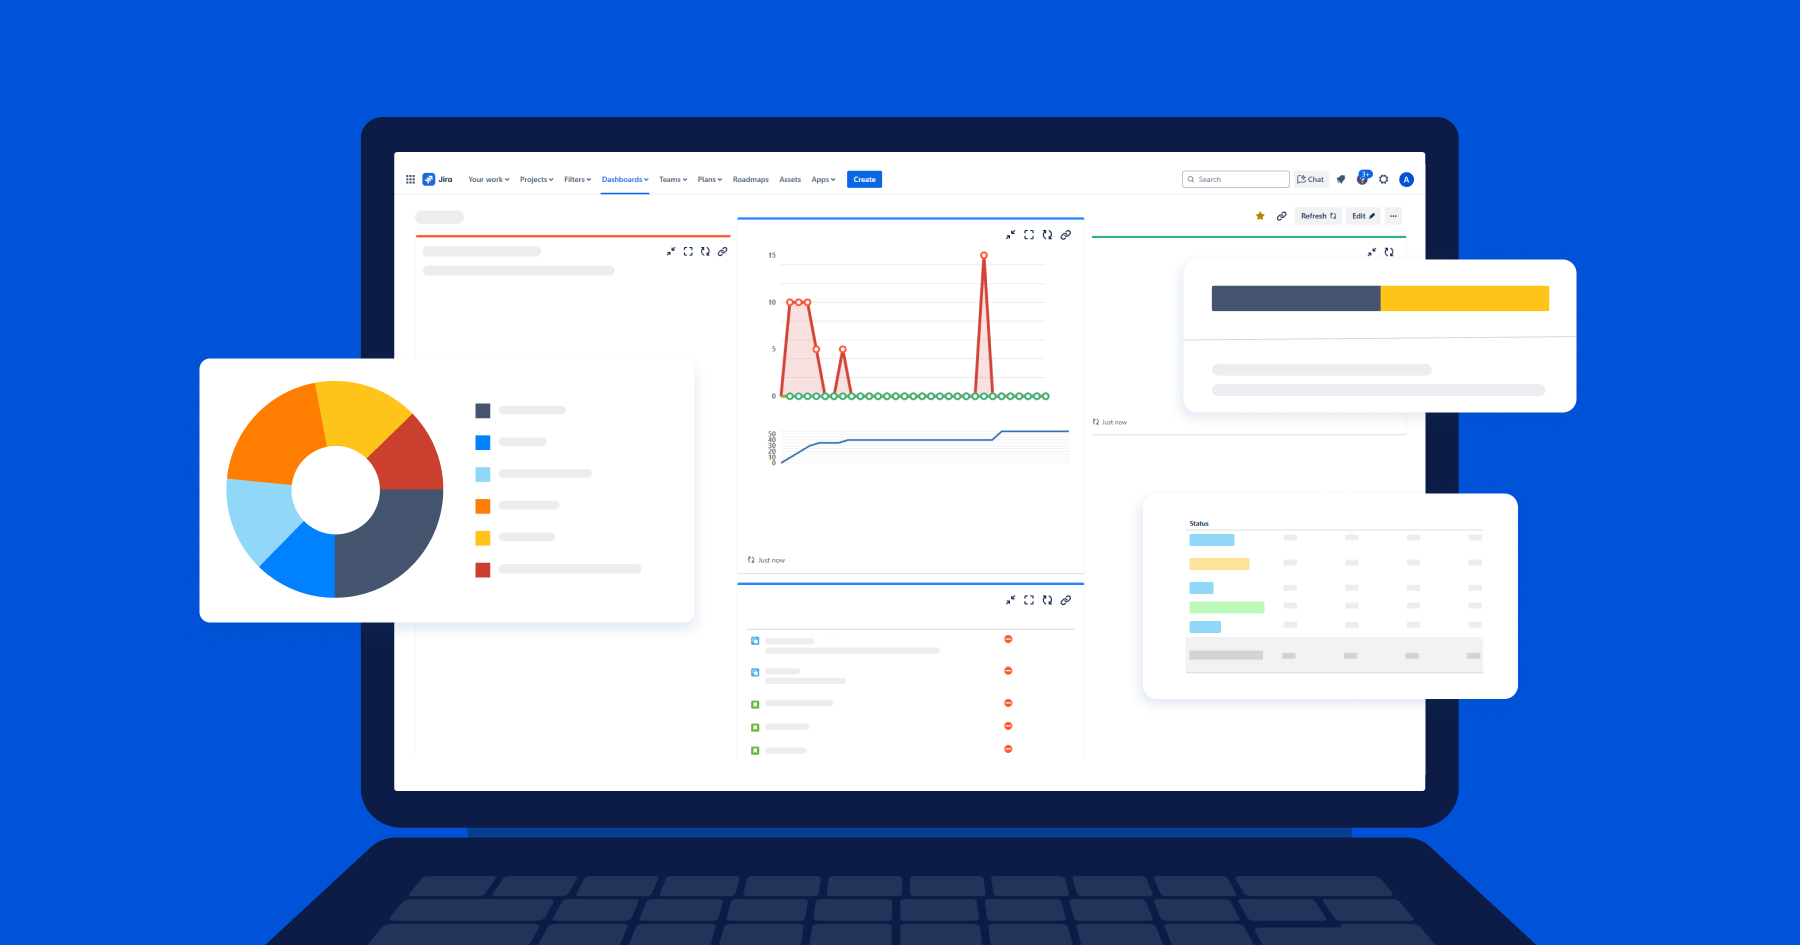
A Jira dashboard is a flexible, customizable homepage in Jira that displays your project’s most relevant information through modular components called gadgets.
When you work in Jira, you can see a visual representation of your ongoing work, designed to highlight key updates, work item progress, and team metrics. It helps you track the flow of work, manage responsibilities, and monitor progress across different types of boards.

Set up a dashboard with gadgets
Step 1: Accessing dashboards
-
In the main navigation bar, select Dashboards > Create dashboard to initiate a new setup.
Step 2: Configuring dashboard settings
-
Give your dashboard a identity:
-
Name: Add a title that reflects its purpose like “Sprint Overview” or “Marketing Campaign Tracker”.
-
Description: Add a short explanation of what this dashboard tracks, which is especially helpful for teams managing cross-project boards.
-
Permissions: Decide who can see or modify the dashboard:
-
Private: Visible only to you.
-
Group: Shared with specific groups.
-
Project: Accessible to members of a particular project.
-
Public: Visible to all users within your Jira instance.
-
-
Step 3: Selecting a layout
Jira offers predefined layouts to organize your dashboard effectively. You can choose between one, two, or three-column formats based on the number and type of gadgets you plan to include.
-
Open your dashboard, click on Edit layout.
-
Choose your preferred column configuration.
Pro tip: A clean layout ensures clarity and helps maintain a continuous flow of information.
Step 4: Adding Gadgets
-
Browse through the available gadgets and click Add.
-
Configure each gadget by selecting relevant filters or projects to display the desired data.
Pro tip: Use gadgets that support continuous flow to help the team respond quickly to changes or blockers.
Create a Jira dashboard
Top gadgets that make your Jira dashboard actionable
The right gadgets convert your dashboard into an operational control center. Each one gives a unique angle on your project’s performance and can be fine-tuned using quick filters or saved queries.
1. Filter Results
Use when: You need a real-time, filter-based list of work items displayed directly on your dashboard.
Ideal for: Showing tasks assigned to you, tracking unresolved bugs, or listing issues in the current sprint or by specific team members.
What it does:
Displays a dynamic list of issues based on a saved filter or JQL query. You can choose which columns to display (e.g., summary, status, priority, due date) and configure how the issues are sorted.
This gadget is especially useful for teams who want to monitor specific workflows or track progress on subsets of work without switching to the full work item navigator.
Pro tip: Use quick filters or team-specific filters to show only the most relevant tasks per user role or sprint.
2. Created vs. Resolved Chart
Use when: You want to monitor how your team is keeping up with incoming work.
Ideal for: QA teams, support desks, or any group that handles high volumes of issue reporting.
What it does:
Displays a trend chart comparing the number of issues created versus those resolved over a selected time frame. It helps visualize workload trends, identify potential backlogs, and assess how effectively your team is handling its issue queue.
Pro tip: A growing gap between created and resolved issues may signal bottlenecks or under-resourcing.
3. Sprint Health Gadget
Use when: You need a quick overview of sprint progress. This filter shows started work, completed tasks, and unresolved blockers.
Ideal for: Daily standups, scrum board updates, or burn tracking.
What it does:
Provides a clear visual snapshot of sprint status, showing the percentage of completed issues, started work, scope changes, and any unresolved blockers. This gadget helps teams quickly assess if the sprint is on track and where attention is needed.
4. Two-Dimensional Filter Statistics
Use when: You want to analyze work item count across two fields.

Configure a Two-dimensional filter statistics gadget
Ideal for: Identifying workload distribution, process bottlenecks, or category trends.
What it does:
Displays a table that groups issues by two selected fields such as Assignee vs. Status or Priority vs. Issue Type based on a saved filter. This gadget helps you quickly spot imbalances or trends across multiple dimensions of your work.
5. Pie Chart
Use when: You want a quick, visual breakdown of work items by a specific field.
Ideal for: Highlighting how tasks are distributed, by assignee, priority, issue type, or status, especially across multiple projects.

What it does:
Displays issues from a selected project or saved filter, grouped by a chosen statistic type. You can group work items by fields like Status, Priority, Assignee, or any custom field to get an at-a-glance view of how work is distributed across your team or backlog.
08 best practices for a perfect dashboard
A dashboard isn’t just a screen full of charts. It’s a strategic tool for driving team alignment, reinforcing project management discipline, and enabling faster decision-making.
Here’s how to keep yours clean, relevant, and actionable.
1. Align Gadget Filter sharing with Dashboard sharing
Each gadget uses a filter - make sure the filter’s sharing settings are aligned with or broader than the dashboard’s sharing.
If a filter is private or restricted, users will see empty gadgets or permission errors even if the dashboard itself is shared.
Always review filter permissions when creating or updating gadgets on a shared dashboard.
2. Name Dashboards clearly and consistently
Follow a standard naming convention: [Team/Project] – [Purpose] – [Owner/Context]
e.g., Marketing - Project Overview - Q2
Avoid vague names like My Dashboard 2
3. Keep Dashboards focused
One dashboard = one goal. Don’t overload with gadgets.
Create separate dashboards for different audiences, e.g., Executives, Developers, QA.
4. Optimize for performance
Minimize the number of gadgets that rely on complex JQL filters or load large datasets.
Avoid unnecessary real-time refresh on gadgets.
5. Group related gadgets logically
Place related gadgets, e.g., sprint burndown, velocity chart, near each other.
Use layout columns to segment different views, e.g., current sprint vs backlog vs blockers.
6. Limit sharing to intended audience
Only share dashboards with relevant groups/projects.
Avoid global sharing unless it’s truly a global dashboard.
7. Audit and clean up old Dashboards
Regularly review and delete or archive unused dashboards.
Keep the dashboard directory clean and maintainable.
8. Train users on how to use and customize dashboards
Encourage teams to clone and adapt dashboards for their own use.
Explain key filters and gadgets during onboarding or sprint retros.
Unlock the full potential of Jira with AgileOps
Whether you’re managing a scrum or kanban board, scaling across multiple teams, or tracking cumulative flow with diagrams like the cumulative flow diagram, the Jira dashboard is your hub for success.
Need help leveraging Jira with dashboards and noteworthy features that supports your business goals?
👉 Contact AgileOps today for a free consultation and optimize your Jira setup to drive better results.
.png)